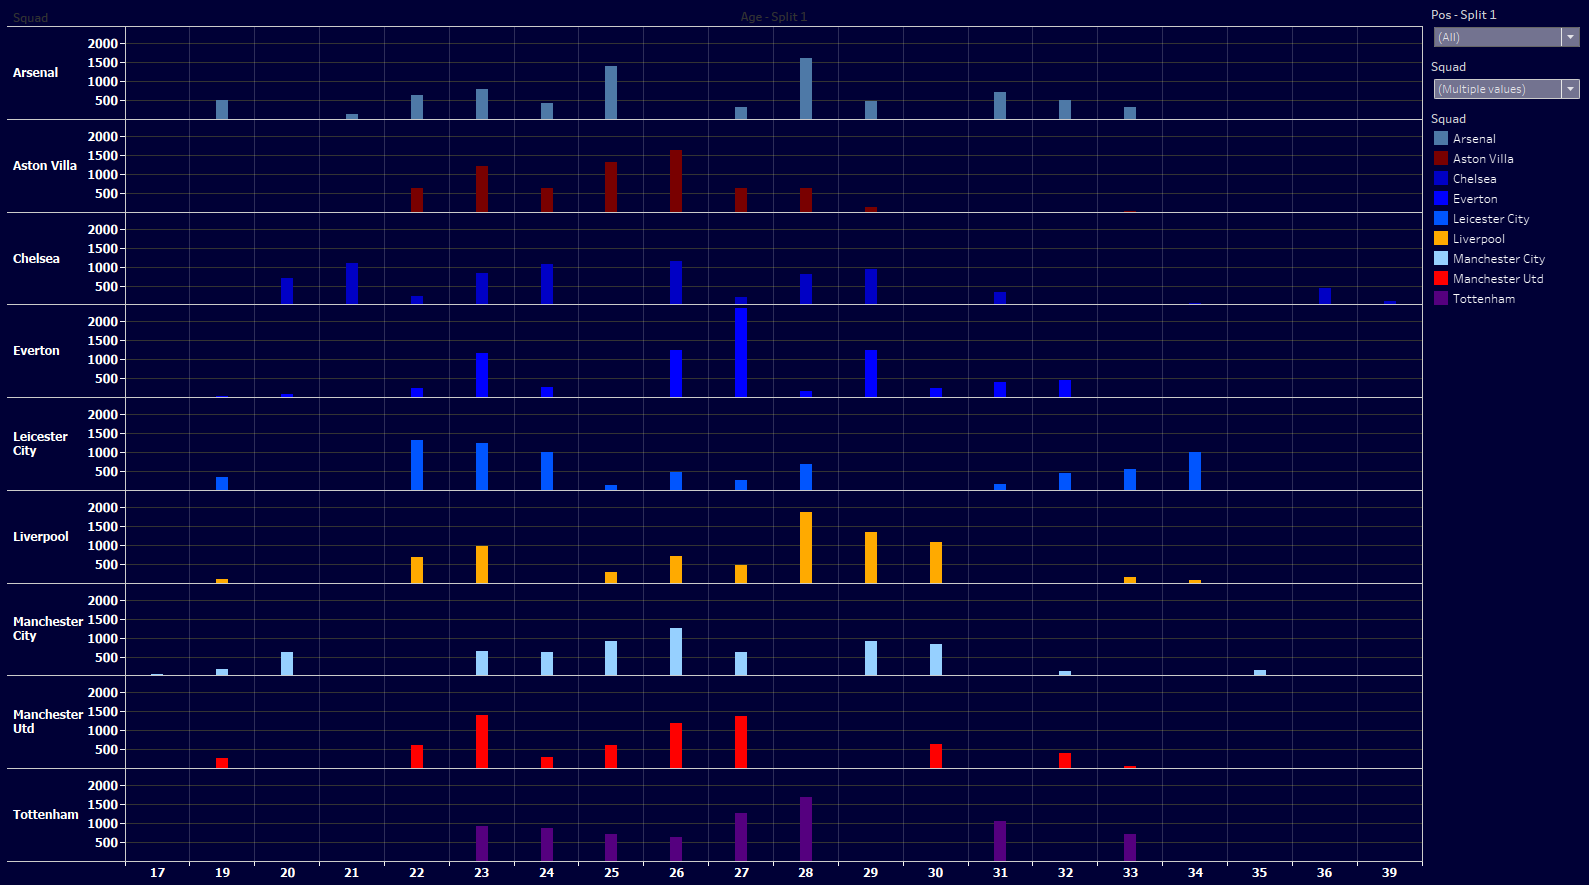
I have been in the bad habit of simply shoving data visualizations straight onto twitter, and not even talking too much about them, or if
Author: Robert Hanson
Chelsea Dashboard – 2019-20: Updated for the End of Year!
It’s been a while since I updated this, as I’ve been busy with many things, most simply life-based, but I wanted to get an update
Table Place Transitions – PL
I wanted to see how much fluxuation and variance there is in the Premier League, from Matchweek 12 to Matchweek 38 in terms of table
My Boy!
I always love my children, all four of them, but sometimes one of them goes above and beyond, and steals just a tiny extra bit
Expected Data – How is it reflecting versus points?
I took a look at some expected goals for and against data, for the Top Five leagues, for the last five seasons plus current (thanks
I’m an Internet (Audio) Celebrity Now!
So, I got to be on a podcast. One that actually really exists, and is on iTunes and everything. Yeah, that’s pretty cool. The folks
Dashboards!
So I put together a dashboard, to track some metrics for the Chelsea football club season this year, 2019-20. It’s going to be a bit
Current List of Published Articles at WAGNH.com
For some reason the SBN search is really wonky, so I thought I would simply list all of the articles I’ve written over there here,
Forgot to mention it here….
But I wrote an article over on WAGNH a couple of weeks ago. https://weaintgotnohistory.sbnation.com/2019/7/26/8931322/a-statistical-comparison-of-willian-and-wilfried-zaha
Shooting and Goals – Time Splits – Premier League
I wanted to take a look at the shooting to goal efficiency in the PL last season, given the terrible job Chelsea did for where

